Dr. Amandine Guissart, Timo Richter
MUEGGE GmbH, Hochstr. 4-6, 64385 Reichelsheim, Germany
Email: info@muegge.de
www.muegge-group.com
ABSTRACT
The usage of microwave (MW) plasma sources comes along with many upsides compared to devices using radiofrequency (RF) waves for igniting and maintaining low pressure plasmas.
In the following we would first like to give insight into the broad variety of microwave plasma applications.
Then we present a thorough investigation of the obtained physical plasma parameters for a range of different gas recipes, gas pressures, flow rates, and power inputs.
We present plasma gas temperatures, electron densities and relative radical densities based on optical emission spectroscopy (OES) measurements.
Furthermore, we investigated the plasma ignition times for different parameter sets, temporal stability of the plasma temperature as well as the reflected microwave power, showcasing the efficiency of the processes.
Index Terms- microwave plasma generation, remote plasma source, downstream plasma source, low pressure plasma, plasma gas temperature, electron density, etch rates, reflected power, ignition time
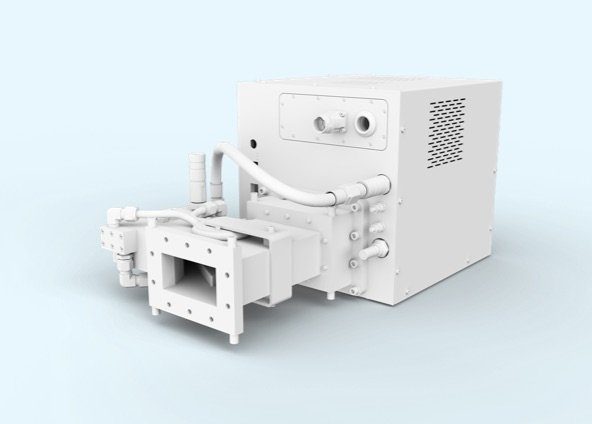
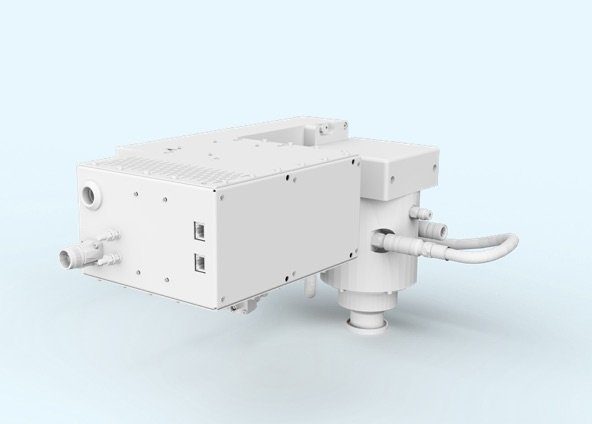
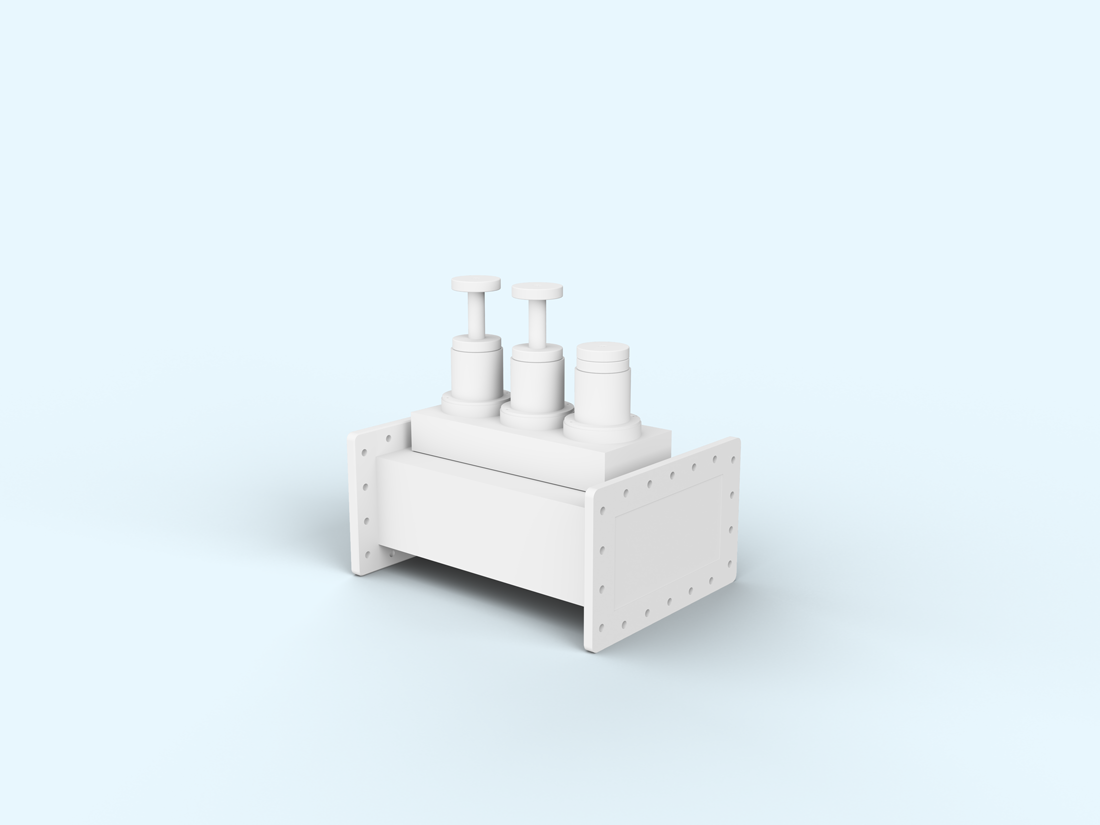
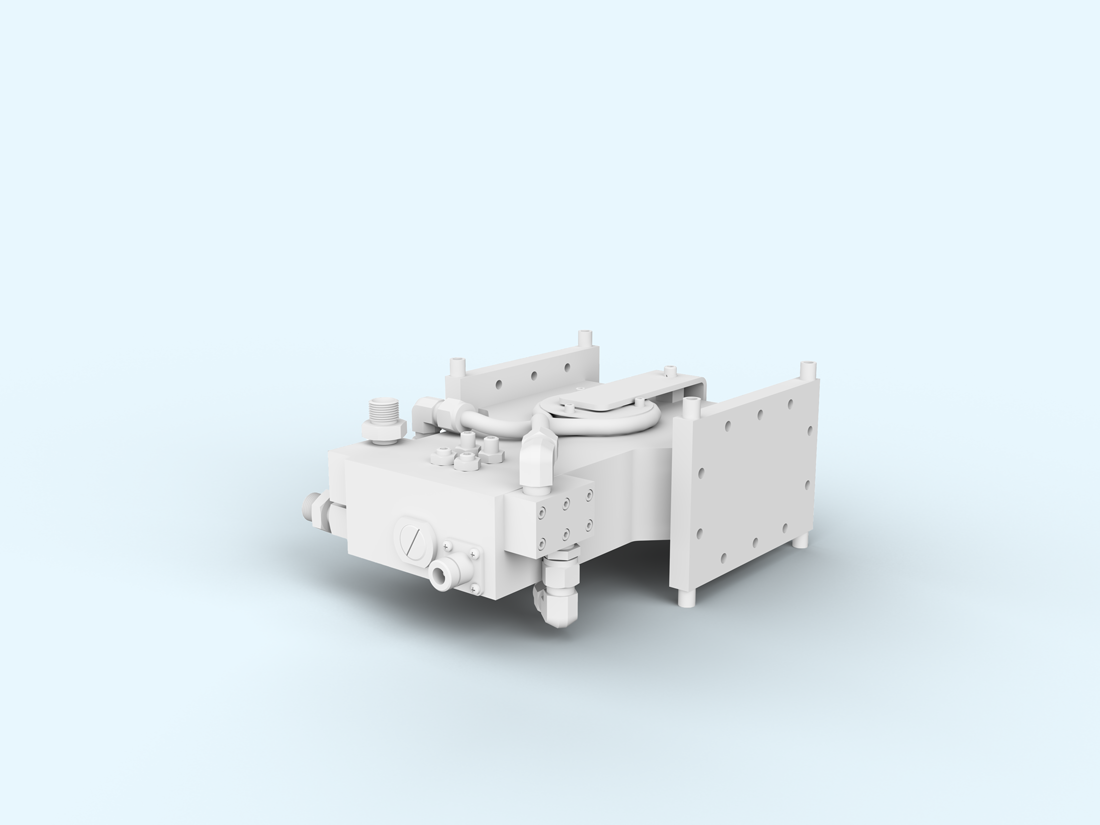
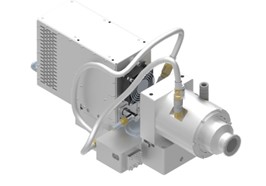
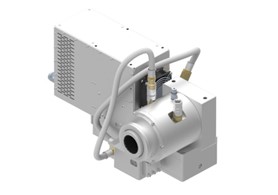
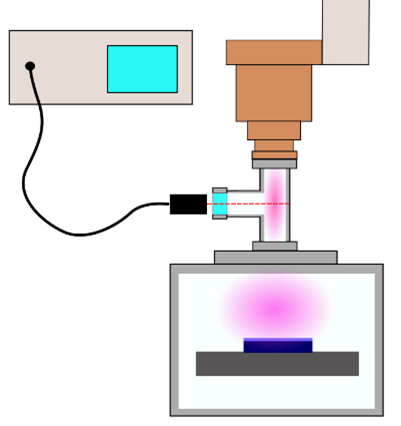
Figure 1: Picture of the RPS with a KF40 adapter in
a) 180-degree configuration and
b) in 90-degree configuration with a ISO-K63 adapter (product number: MA3000C-743BB/ MA3000C-713BB)
PRODUCT DESCRIPTION
The Remote Plasma Source (RPS) model Industry 4.0 is a complete microwave system designed for easy turnkey integration. It offers a wide process range of gases, gas flow rates, pressures and power.
The product is optimized for a long lifetime and low cost of ownership.
Technical dates of the product are presented in Table 1. The applicator is optimized so that plasma ignition is possible with all process gases mentioned in the table without the need for argon as an ignition gas.
Microwaves (2.45 GHz) are generated using a magnetron. Through a waveguide and an antenna, they enter a resonance cavity where a very high electric field strength is realized. Free electrons in the process gas are accelerated and perform inelastic collision processes with heavier particles, leading to a chain reaction that results in the ignited plasma.
The ignition is happening in a ceramic cup that allows the usage of fluorine and non-fluorine chemistries.
Figure 2 presents how the antenna transports the microwaves into the plasma applicator. The geometry is optimized for the frequency of 2.45 GHz so that a resonance is realized, and a high electric field strength is achieved inside the ceramic tube to ensure a fast and consistent plasma ignition.
If the plasma has not yet been ignited, or if there is no gas flow, a high fraction of the microwave power would be reflected back towards the magnetron head. Therefore, an isolator is integrated which absorbs any microwave power that couldn’t be absorbed by the plasma.
MICROWAVE PLASMA PROPERTIES AND APPLICATIONS
As the microwaves are entering the plasma gas, the much lighter electrons can follow the high frequency field change in contrast to the heavy ions. Before the field polarity changes with a frequency of 2.45 GHz, the electrons perform inelastic collisions with heavier particles, which results in an energy transfer and different processes such as dissociation, ionization and excitation. Since the heavier ions can barely build up speed until the field direction changes again, the energy is mostly absorbed by the electrons in the plasma gas, which results in low energy ions. The situation is depicted in Figure 3.
The fact that heavy ions in a microwave plasma have low kinetic energy is one of the main differences in comparison to radiofrequency plasma sources. For MW plasmas, the effect of ion bombardment on the sample is negligible, which results in pure-chemical etching processes.
An electromagnetic wave can only propagate in a plasma if the EM-wave frequency is larger than the plasma frequency, otherwise it gets exponentially damped.
Since the frequency of a MW is much larger than that of a RF-wave, the waves can penetrate at a higher plasma frequency.
Because of that, usually for MW generated plasmas a higher electron density can be realized as compared to RF technology.
Microwave plasma technology enables a variety of different applications:
1. Decapsulation of chips/microchips
2. Chemical vapor deposition
3. Surface passivation and activation
4. Cleaning of plasma deposition chambers
5. Waste gas cleaning
6. Fast photoresist and polymer removal
Alongside the following upsides:
1. Pure isotropic etching
2. Highly selective etch processes
3. No ion bombardment/pure chemical etching
4. Low thermal load on the substrate
5. No electric field and plasma in the process chamber
6. No additional ignition gas is necessary
7. No charging of the substrate
PLASMA IGNITION TIME MEASUREMENTS
To characterize the RPS, ignition time measurements have been performed using a variety of different gas mixtures, flow rates and two different pressures. The results are shown in figure 4. From the figure most of the investigated recipes are igniting very quickly, while only some gas mixtures of nitrogen and carbon tetrafluoride are igniting slower than 200 ms.
REFLECTED POWER
Usually, because of its high density, the plasma can’t absorb 100% of the forward microwave power. This leads to a small amount of power being reflected back towards the magnetron head. The integrated isolator absorbs 100% of the reflected power and prevents the magnetron and other components from taking any damage. Using a diode, the reflected power can be measured as of a voltage signal. Opposite to RF plasma sources, reflected power is not harmful to the system and can instead be used as a measure for process efficiency and process control.
For a variety of different plasma gas recipes using oxygen, nitrogen and carbon tetrafluoride as well as different pressures (1-6 Torr), different flow rates (500-5000 sccm) and a broad range of powers (400-3000 W) the reflected power has been investigated. For the broad range of measurements, the percentage of power being reflected reaches values of <5% in the power range of 2 kW-3 kW in all cases.
PLASMA PROPERTIES
The following results are based on optical emission spectroscopy measurements. The experimental geometry is shown in Figure 5. For the measurements, a spectrometer from PLASUS (EMICON SA) was used. The emitting light from the plasma was measured in between the RPS and the process chamber using a T-shaped vacuum pipe. This geometry was chosen so that the plasma properties can be investigated as the plasma stream is entering the process chamber.
NITROGEN-OXYGEN PLASMA PROPERTIES
Measurements have been performed using a plasma recipe with 20% nitrogen and 80% oxygen. A small amount of nitrogen added to an oxygen plasma is known to increase the oxygen radical density.
Plasma properties have been studied for different flow rates and powers.
Figure 6 shows the plasma gas temperatures that have been obtained for all measurement runs. The temperatures have been evaluated using the free software “massive OES” [2] which allows batch processing of spectra. For the evaluation, the C-B band system of molecular nitrogen in the range of 300-380nm was used.
As can be seen in the figure, the plasma gas temperature increases almost linearly which power, and it decreases with an increasing flow rate.
Figure 7 shows the electron densities in the plasma for the data plasma recipe, flow rate and power range. These data points have been obtained by evaluating the line intensity of two nitrogen spectral lines and using an approximated formula for the electron density [3].
The electron density shows almost the same dependency on power and flow rate as the plasma gas temperature, an increase for higher power and a decrease for higher flow rates.
OXYGEN-NITROGEN-CF4 PLASMA PROPERTIES
The spectra of a typical plasma recipe used for photoresist etching containing oxygen, nitrogen and CF4 is shown in Figure 8 for three different power levels.
The spectra are dominated by the oxygen radical peaks, while fluorine radical peaks and a contribution of nitrogen molecules are also visible.
By using a small amount of Argon as an actinometer, it is possible to evaluate relative radical densities of oxygen and fluorine radicals in the plasma by comparing specific peak intensities in the emission spectrum of the plasma (Ar 750 nm, O 844 nm, F 704 nm). Calculating absolute values would require knowledge of the shape of the electron energy density function (EEDF), which wasn’t obtained in the present work.
The calculated values are shown in Figure 9. The graph shows that the oxygen radical density is increasing more strongly with power than the fluorine density.
The densities seem to increase in a linear fashion, while the slope shows a kink at about 2000 W.
PULSED PLASMA PROPERTIES
Operating microwave plasmas in pulsed mode can have several advantages such as higher etching rates, better uniformity and less damage to the sample.
The power supply (article number: MX3000D-171KL) allows a pulsed mode of active time and down time down to 250 microseconds, allowing a pulsing frequency up to 2 kHz at 50% duty.
Figure 10 shows the spectrum of an O2, N2, CF4 plasma. The peak at 844 nm is related to the oxygen radicals in the plasma and is showing an increase and a maximum for a pulsing frequency of 100 Hz. The same is true for the peak relating to the fluorine radicals in the plasma.
PLASMA STABILITY
To investigate the temporal stability of the plasma gas temperatures have been evaluated for several time stamps after ignition had taken place. The measurements were performed in a nitrogen-oxygen plasma.
The results are shown in Figure 11 for three different power levels. The data shows that the plasma temperature reaches a constant level almost immediately after ignition with no visible “warm-up” time.
References
[1] Spectroscopic Analysis of CF4/O2 Plasma Mixed with N2 for Si3N4 Dry Etching, W. S. Song, J. E. Kang, S. J. Hong, Coatings, 2022
[2] J. Vor¨ıˇc, P. Synek, L. Potoˇc¨ıkov¨ı, J. Hnilica, and V. Kudrle, “Batch processing of overlapping molecular spectra as a tool for spatio-temporal diagnostics of power modulated microwave plasma jet,” Plasma Sources Science and Technology, vol. 26, no. 2, 2017
[3] Fatima, H., Ullah, M.U., Ahmad, S. et al. Spectroscopic evaluation of vibrational temperature and electron density in reduced pressure radio frequency nitrogen plasma. SN Appl. Sci. 3, 646 (2021). https://doi.org/10.1007/s42452-021-04651-z